Column
SPERA PHARMA's Structural Analysis Capabilities Integrating 3D ED / MicroED Technology
2026.03.06
Structure determination is one of the most critical challenges in advancing drug discovery research and process development. Conducting this process swiftly and accurately allows us to obtain multiple opinions from chemists with diverse research backgrounds, based on precise chemical finding derived from structural data. Consequently, we can establish a clear research direction for subsequent steps, significantly accelerating drug discovery research.
At SPERA PHARMA, we have been striving to enhance our structural analysis capabilities by adding the latest 3D Electron Diffraction (3D ED) and Microcrystal Electron Diffraction (MicroED) 1-3) technologies into our lineup of basic structural analysis equipment. This integration aims to further breakthrough on our structural analysis proficiency. In this article, we detail our initiatives, outlining the general workflow of structural analysis and showing recent case studies that utilize 3D ED / MicroED) technologies.
目次
Current Status of Structural Analysis of Organic Compounds
In a typical structural analysis workflow (Scheme 1), synthetic organic chemists begin by measuring various spectroscopy, including 1H-NMR, 13C-NMR, DEPT135, DEPT90, every kind 2D-NMR techniques, MS, and IR. These measurements help estimate the planar structure (atom connections) of the compound. For simple compounds, if 1H-NMR alone suffices to estimate the desired structure, it is generally safe to proceed with synthesis and process studies. However, for regioselective reactions, stereoselective reductions, or the synthesis of sp3 rich polycyclic compounds, it is advisable to also measure NOE and NOESY in advance. Additionally, by interpreting the J values of the 1H-NMR signals and the dihedral angles of vicinal hydrogens obtained from the Karplus curve, a comprehensive molecular structure model emerges in our minds. This molecular model allows us to predict which parts of the molecule will react with the chosen reagents in the next synthetic step. Conversely, if the reaction does not proceed as expected, this data is crucial for identifying the cause.
For example, when synthesizing terpene compounds, the central skeleton of these compounds is often composed entirely of carbon atoms, making it difficult to determine the complete structure using only NMR-based measurements. Additionally, natural product researchers who target these compounds also face significant challenges in structure determination.
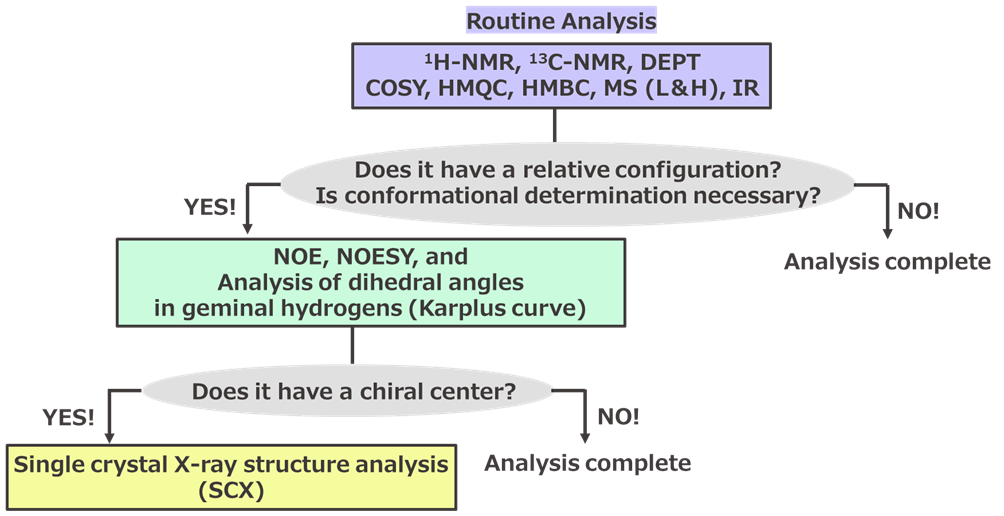
Scheme 1. General Workflow for Structural Analysis of Organic Compounds
Current Status of Crystal Structure Analysis
For researchers engaged in process development, the scope of “Structure Determination” extends further. It is essential to accurately determine the structure of crystals obtained as active pharmaceutical ingredients (APIs) or intermediates. Typically, crystals can exist in various forms, including single-component crystals, solvates, co-crystals, and salts, among others (Figure 1).
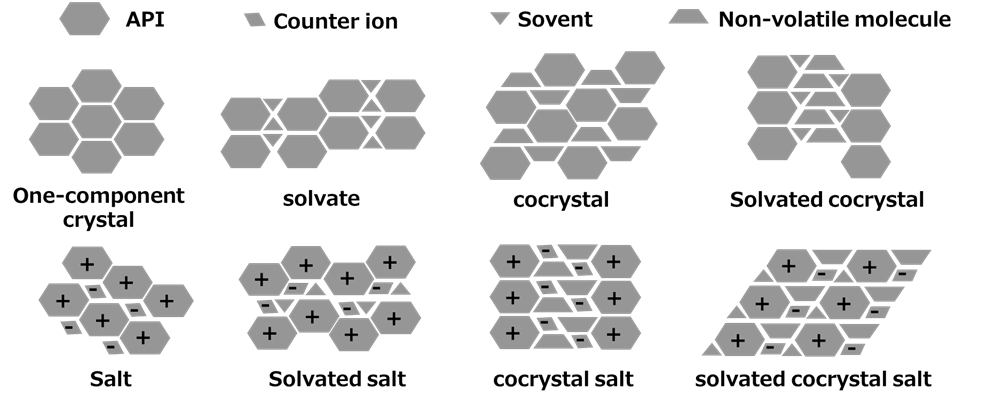
Figure 1. Classification of Multi-component Crystals
Regardless of the crystal pattern, the first step is to measure 1H-NMR to confirm the presence of the desired active ingredient including coformers, salt formers, crystallization solvents, and crystal water in the case of two-component systems. However, since the crystal is dissolved in a deuterated solvent, it is impossible to determine if it was truly present in the crystal. Therefore, powder X-ray diffraction (PXRD) is commonly used next (Figure 2). This confirms that the substance is indeed crystalline and, in the case of two-component crystals, proves that it is not merely a mixture. However, there is one point to be cautious about with multi-component crystals: the polymorph of the active ingredient or conformer could unfortunately appear, making it misjudge the desired new crystal. This is a phenomenon we frequently encounter in our daily crystal screening work.
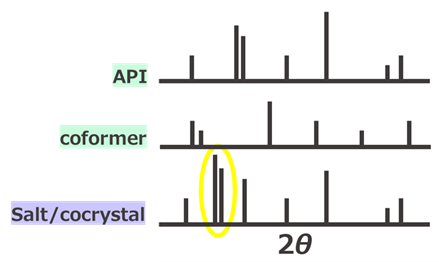
Figure 2. Estimation Method for Salts/Co-crystals Using Powder X-ray Diffraction (PXRD)
Therefore, the most reliable method is single-crystal X-ray structure analysis. After measurement and analysis, the desired molecule can be clearly identified within the unit cell as an ORTEP (Oak Ridge Thermal Ellipsoid Plot), making it easy to determine if it is the desired crystal. However, this method requires high-quality crystals of relatively large size, around 100 μm. Researchers invest significant effort into creating these single crystals to proceed with drug discovery and process development. They often closely observe the crystallization sample tubes, worrying about the crystal growth. Unfortunately, only about 30% of crystalline substances yield crystals suitable for single-crystal X-ray structure analysis4). If high-quality crystals cannot be obtained, researchers often must abandon structure determination.
To overcome this situation, advanced research on single-crystal X-ray technology has been actively conducted in recent years. As a result, breakthroughs such as the development of rotating anode highlybright X-ray generators and shutterless semiconductor detectors have been achieved. Nowadays, it has become possible to determine the structure of crystals as small as a few micrometers to 10 micrometers. However, a so-called “1 μm wall,” still exists and it becomes challenging to determine the structure of crystals smaller than this size, even with synchrotron radiation. Many compounds only form powder-like shape smaller than 1 μm, and to complete structure determination, additional efforts such as derivatization or co-crystallization are required.
About 3D ED / MicroED Structure Analysis
In recent years, 3D ED / MicroED (Microcrystal Electron Diffraction) crystal structure analysis has been attracting worldwide attention. This measurement method easily overcomes the ‘1 μm wall,’ representing a significant challenge, and is a revolutionary analytical technique that can determine the structure of organic compounds in a relatively short time, even if they are only 100-500 nm in size. Although diffraction by electron beams were naturally known, the severe electron-beam damage to compounds, leading to decomposition (loss of crystallinity), was a significant issue. However, recent developments in highly sensitive semiconductor detectors have allowed these issues to be avoided, enabling sufficient diffraction data to be obtained even with short measurement time. In 2013, Gonen et al. reported the 3D ED / MicroED structure determination of proteins, which attracted significant attention 5). Furthermore, in 2018, the structure determination of small molecules 2,3) were reported, and the same year it was selected as Science’s 2018 Breakthrough of the Year, among other increasing application examples.
The measurement method for 3D ED / MicroED is shown below (Figure 3) First, prepare a special copper grid with a diameter of about 3mm. Meanwhile, crush the crystals to be measured into fine powder using a glass plate or mortar. If the crystal is already microcrystalline, this step is unnecessary. Next, touch the grid to the powder to mount the crystal. Set the mounted grid into the device using an appropriate holder. Then, switch between electron microscope mode and electron diffraction mode to find the best single crystal. Once a good crystal showing clear diffraction spots up to high angles is found, proceed with the main measurement by accumulating data using the limited field electron diffraction method combined with the single-axis rotation method. After the main measurement, use any structural analysis software to perform initial structure calculation and structure refinement, similar to single-crystal X-ray structure analysis. Unlike single-crystal X-ray structure analysis, which collects data from all directions, 3D ED / MicroED can only obtain data through single-axis rotation due to its principle. Therefore, if a crystal with low symmetry is encountered, it may be challenging to obtain the initial structure. In any case, the measurement itself is relatively short 6).
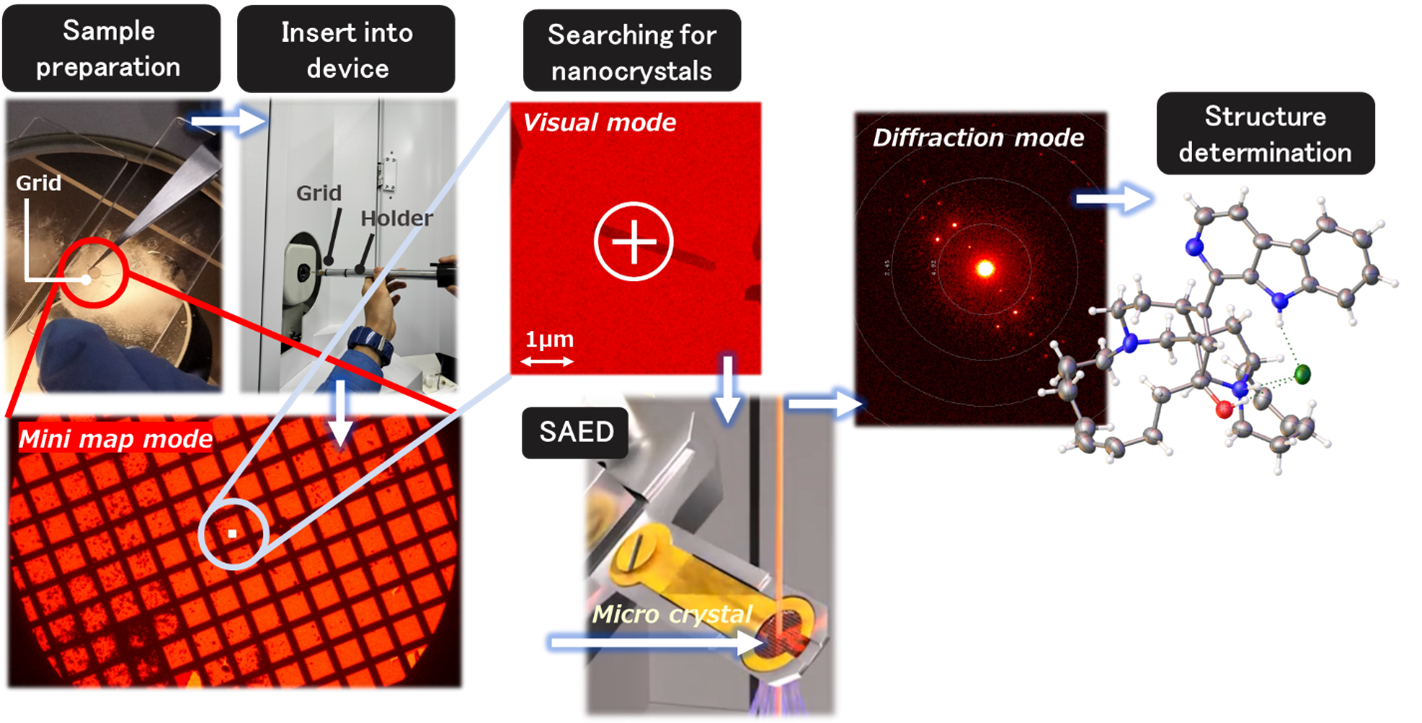
Figure 3. Workflow of 3D ED / MicroED Measurements
Our company has integrated the 3D ED / MicroED equipment (XtaLAB Synergy-ED®) from Rigaku to enhance process development and crystal screening, and to provide high-value crystallographic information to our customers. We aim to accelerate these processes and offer superior solutions. In the following section, we highlight several successful case studies where 3D ED / MicroED structure analysis was employed to determine the structures of compounds that were challenging to analyze using single crystal X-ray structural analysis.
Distinguishing Salts/Co-Crystals7)
Finaldetermining whether a prepared crystal is a salt or a co-crystal often presents challenges. A ‘salt’ is defined as a crystal formed through ionic bonding, where the proton of an acidic substance transfers to the basic substance. Conversely, if the crystal forms without proton transfer, it is termed a ‘co-crystal.’ Therefore, to ascertain whether a crystal is a salt or a co-crystal, one must determine whether proton transfer has occurred.
The significance of precise structural determination is frequently questioned. However, stating that ‘the position of hydrogen is not determined’ is analogous to saying that the position of hydrogen is not well understood in 1H-NMR. Among synthetic chemists, some researchers believe that as long as the number of hydrogens and carbons is correct, it suffices. Nevertheless, this cannot be considered a complete structural determination, except when prioritizing speed in developing synthetic routes. Similarly, estimating whether a compound is a salt, or a co-crystal based on the determination of hydrogen positions is a crucial issue that should not be overlooked from the perspective of the completeness of structural determination.
Figure 4 shows various analytical instruments related to the structural determination of salts/co-crystals. Commonly used techniques such as 1H-NMR and PXRD do not provide information on the crystal structure, and therefore, cannot fundamentally distinguish between salts and co-crystals. However, crystal structure information can sometimes be obtained using the Rietveld method.
Three primary methods have been used to distinguish between salts and co-crystals.
The first method involves measuring the bond distances of the carboxylic acid moiety (C=O, C-O) obtained from single-crystal X-ray structure analysis 8). The shorter bond is identified as the carbonyl, and the longer bond as the hydroxyl group, allowing the inference that the OH group is present on that side, indicating a co-crystal. Conversely, if the bond distances between the two carbon-oxygen bonds are equal, it suggests proton dissociation and an average resonance structure, indicating a salt. However, this method requires high-quality crystals that are well-crystallized and relatively large, around 100μm. Without such crystals, the measurements cannot proceed.
The second method utilizes neutron diffraction 9). Neutrons interact directly with the atomic nucleus, making it the only analytical instrument capable of accurately determining the position of hydrogen atoms, which have minimal electrons. X-rays, which interact with electrons, have very low detection sensitivity for hydrogen atoms with only one electron. However, neutron diffraction is conducted using specialized facilities, which poses a significant drawback as organic chemists like us do not have easy access to this equipment.
The third method involves solid-state NMR (NMR crystallography)10). By carefully observing the chemical shifts around protonatable nitrogen atoms, it is possible to estimate whether a compound is a salt or a co-crystal. However, this device is also not readily available for casual use.
As such, traditional analytical methods alone do not easily allow for the structural determination of salts and co-crystals. Therefore, we explored the possibility of distinguishing them based on hydrogen position determination using 3D ED / MicroED.
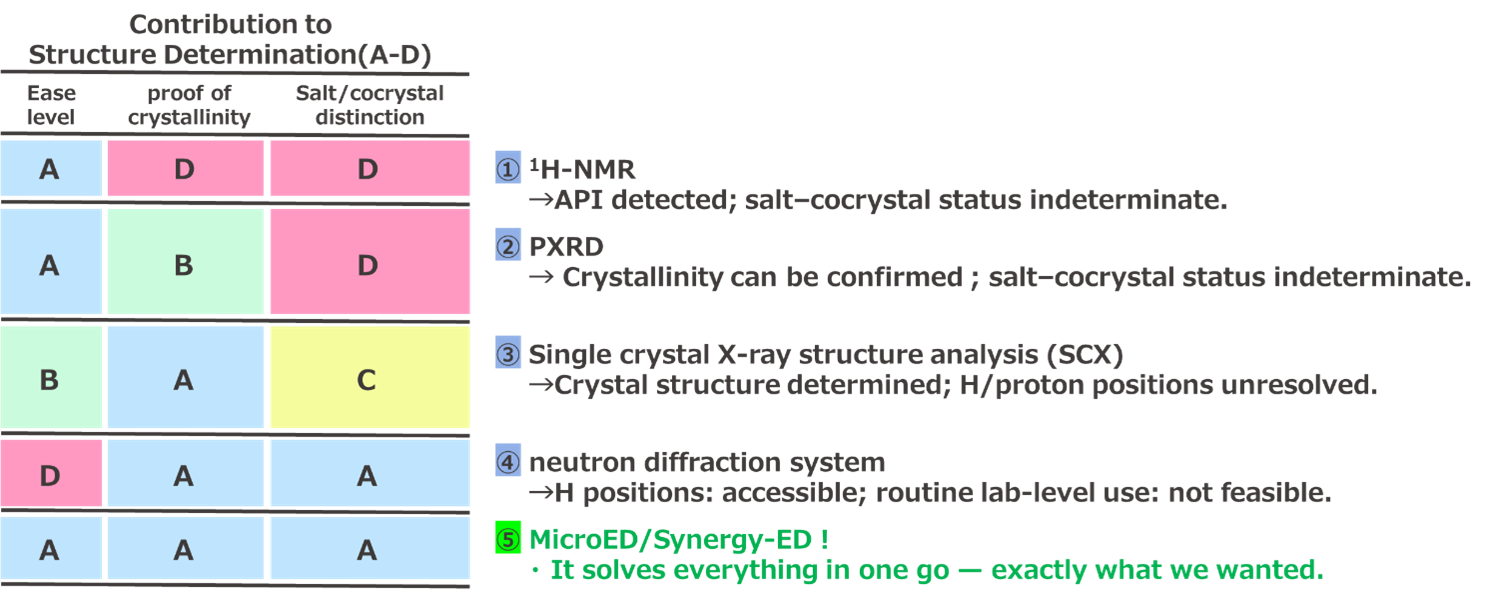
Figure 4. Analytical Instruments for Structure Determination and Salt/Co-crystal Discrimination
Ensitrelvir fumaric acid co-crystal is a therapeutic agent for COVID-19 recently developed by Shionogi & Co., Ltd. (Figure 5) 11). This compound has been proven to be a co-crystal by Shionogi & Co., Ltd. using the method of single crystal X-ray structural analysis, specifically examining the bond distance of the carboxylic acid part of fumaric acid. 12)

Figure 5. Entrectinib Fumaric acid Co-crystal (Zokova®)
We investigated the possibility of proving the co-crystal based on the determination of hydrogen positions using 3D ED / MicroED, with this compound as a model. As the result, Q peaks (electron density) were clearly observed around the carboxylic acid, as shown below. These peaks can be regarded as hydrogen atoms, so the bond distances around them were measured. The results were as follows: in one part, O38-Q1; 1.044(4) Å vs N9-Q1; 1.558(4) Å, and in the other part, O41-Q2; 1.045(6) Å vs N23-Q2; 1.727(4) Å. From these results, it was found that the carboxylic acid did not ionize, and the protons did not transfer to the nitrogen atom, indicating that it is a co-crystal. The electron density viewby the d-Fourier map also clearly shows that the results are valid. This study of the ensitrelvir fumaric acid co-crystal demonstrates the high effectiveness of 3D ED / MicroED in determining hydrogen positions (Figure 6).
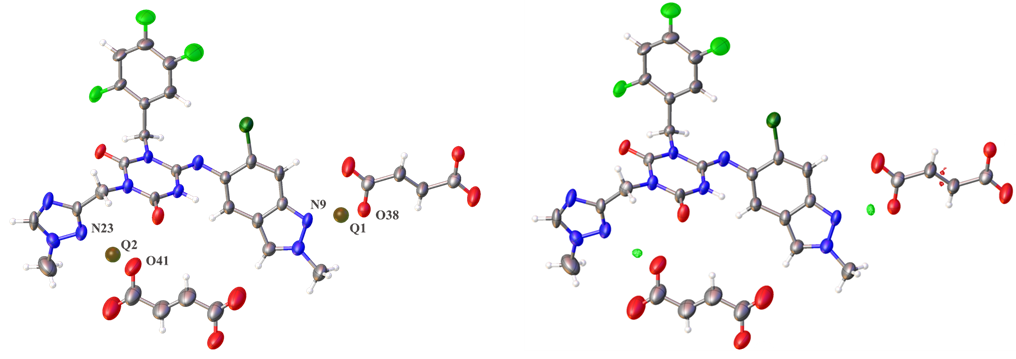
Figure 6. Determination of Hydrogen Positions in Ensitrelvir Fumaric acid Co-crystal by 3D ED / MicroED
(ORTEP diagram: Left – Q-peak view, Right – d-Fourier map)
Crystal Polymorph Identification
Casopitant mesylate (Figure 7) is an NK-1 receptor antagonist under development by GlaxoSmithKline K.K. 13) The crystal polymorphs Form 1 and Form 3 of this compound give very similar charts in analytical methods such as reflective PXRD, thermal analysis, IR, and Raman spectroscopy, making it extremely difficult to distinguish between them using these methods (Figure 8). However, the two polymorphs can be distinguished to some extent using solid-state NMR and transmission PXRD charts, revealing that what was previously thought to be a single crystal form is a mixture of two polymorphs (Form 1 and Form 3). Additionally, separating the two polymorphs is challenging, and obtaining pure polymorph crystals have been deemed impossible.

Figure 7. Casopitant Mesylate
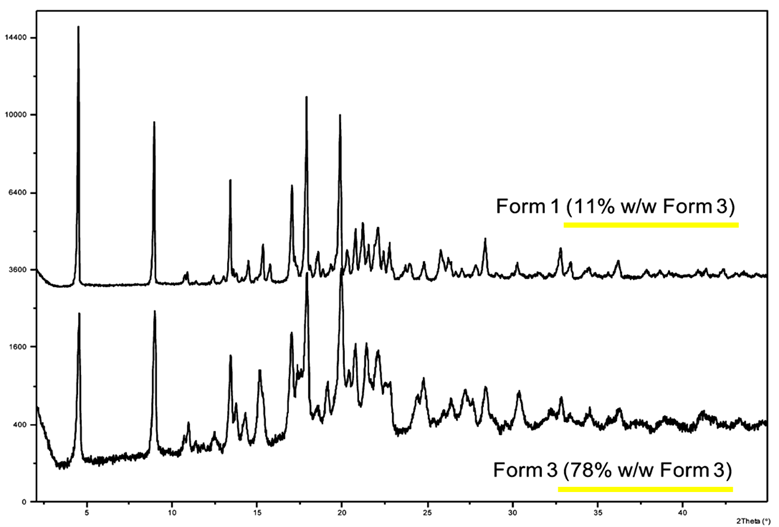
Figure 8. PXRD Charts of Casopitant Mesylate Forms 1 and 3 (Excerpt from the Paper)
To investigate whether it is possible to determine the structures of Form 1 and Form 3 from a single sample of this unique polymorphic mixture using 3D ED / MicroED, we conducted an experiment. As the result, we successfully derived the crystal structures of both Form 1 and Form 3 from the single sample with a Form 1 to Form 3 ratio of approximately 9:1. The advantage of 3D ED / MicroED is that it allows for structure analysis of a single microcrystal under an electron microscope using the limited field electron diffraction method, making it possible to analyze mixtures without any issues. Furthermore, the overlay of these 3D molecular structures revealed that the conformations of both forms are extremely similar (Figure 9). Additionally, since both forms have the same space group, P21, it was concluded that the similarity in physical properties is likely due to the similarity in crystal symmetry and molecular conformation. This simultaneous structure determination of the casopitant mesylate “polymorphic mixture” is a good example of the high efficacy of microcrystal measurement using 3D ED / MicroED.
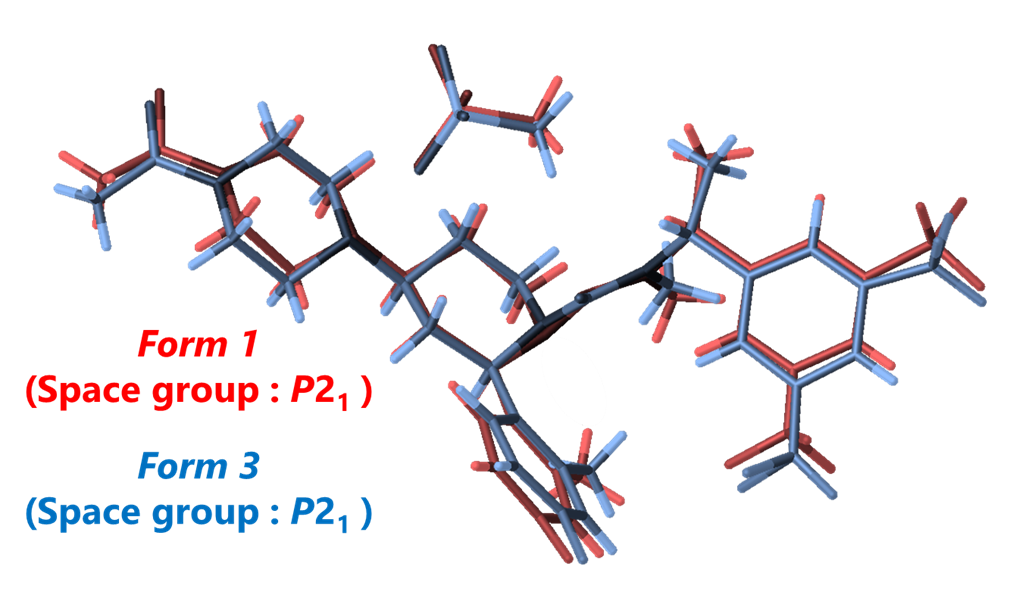
Figure 9. Stereo configuration Comparison of Casopitant Mesylate Forms 1 and 3 via 3D ED / MicroED
Determination of Absolute Configuration
Throughout its long history, single-crystal X-ray structure analysis has been predominantly used for the determination of absolute configuration. One of the major advantages of single-crystal X-ray structure analysis is that it does not require a database or chemical composition; all that is needed is a single crystal. By using the Flack parameter, single-crystal X-ray structure analysis can determine absolute configuration, making it an indispensable analytical method in the fields of organic synthesis and natural product chemistry. However, as mentioned earlier, if the desired crystal size cannot be obtained, this method cannot be utilized effectively.
Unlike single crystal X-ray structural analysis, 3D ED / MicroED allows for the determination of absolute configuration by measuring microcrystals and performing Kinematical analysis, followed by Dynamical refinement while constructing structural models for both enantiomers. Essentially, both single crystal X-ray and 3D ED / MicroED utilize the “disturbed Friedel’s law,” but in the case of 3D ED / MicroED, the disturbance is due to multiple scattering, conducting Dynamical Refinement that fully considers dynamical diffraction phenomena. After Dynamical Refinement, R1 (dyn) values are calculated for each enantiomer. If these, R1 (dyn) values differ by approximately 1% or more, the enantiomer with the lower value is considered to have the correct absolute configuration.
We demonstrated the determination of absolute configuration using 3D ED / MicroED, the method 14-16) that has not been widely utilized globally, by applying it to the known natural product (+)-Manzamine A 17,18) .
The result of 3D ED / MicroED measurements and structural analysis showed that the difference in R1 (dyn) values with the (-)-manzamine A model was 3.82%, confirming that it is the known (+)-manzamine A (Figure 10) [(+)-form; R1 (dyn) 14.01%, (-)-form; R1 (dyn) 17.83%]. This demonstrated that it is possible to accurately determine the absolute configuration even in complex natural products.
3D ED / MicroED has become a highly convenient tool for researchers across various fields, as it allows for the determination of absolute configuration from fine crystalline powders obtained simply by evaporating the solvent, without the need for extensive crystallization efforts.
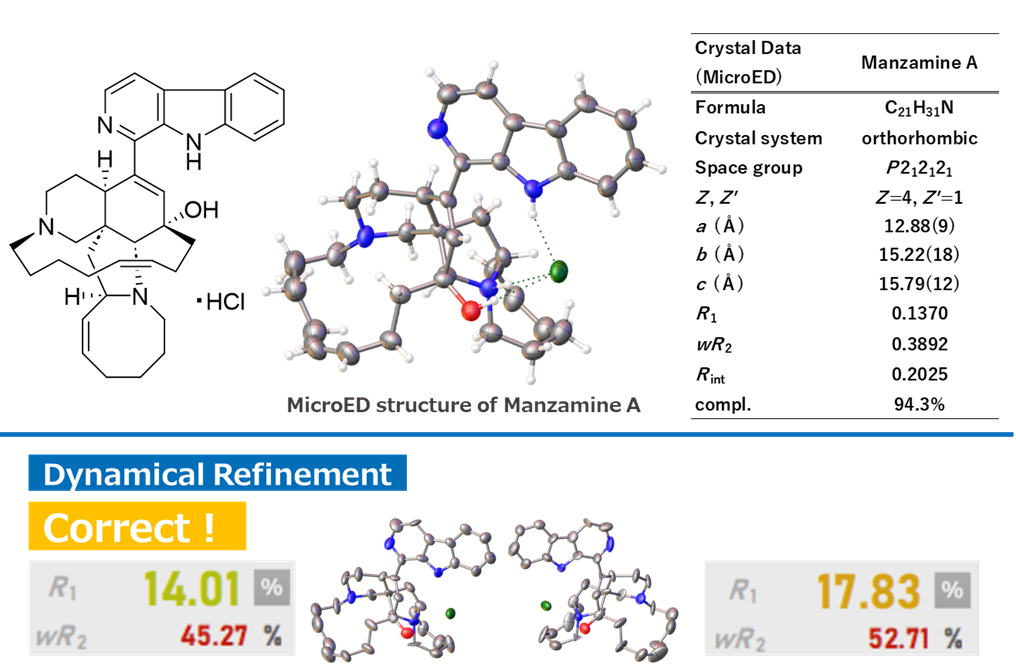
Figure 10. Determination of the Absolute Configuration of (+)-Manzamine A by 3D ED / MicroED
Conclusion
In this article, we have described the process of structure determination in organic compounds and crystals, shedding light on the areas where various analytical instruments face challenges. Additionally, we have illustrated the power of 3D ED / MicroED in delivering smart structure determination results by effectively complementing the weaknesses of these instruments with several case studies. By incorporating 3D ED / MicroED as a routine analytical tool, the quality and speed of our process synthesis research and crystal screening have seen remarkable improvements compared to previous manners.
It is only a matter of time before 3D ED / MicroED becomes widely adopted globally, heralding a new era of drug discovery based on this technology. However, we firmly believe that the most rational approach to structure determination involves conducting thorough analyses based on NMR and other foundational techniques and then integrating 3D ED / MicroED technology. Our company continues to strive for improvements in synthetic technology, the creation of new synthetic techniques, and the efficiency of crystal screening. We are also working on developing crystallization methods for compounds with poor crystallization, aiming to provide better solutions to our customers for high-difficulty challenges.
References
1) Gemmi, M.; Lanza, A. E., 3D electron diffraction techniques., Acta Cryst., 2019, B75, 495-504.
2) Gruene, T.; Wennmacher, J. T. C.; Zaubitzer, C.; Holstein, J. J.; Heidler, J.; Fecteau-Lefebvre, A.; De Carlo, S.; Müller, E.; Goldie, K. N.; Regeni, I.; Li, T.; Santiso-Quinones, G.; Steinfeld, G.; Handschin, S.; van Genderen, E.; van Bokhoven, J. A.; Clever, G. H.; Pantelic, R., Rapid Structure Determination of Microcrystalline Molecular Compounds Using Electron Diffraction., Chem. Int. Ed., 2018, 57, 16313-16317.
3) Jones, C. G.; Martynowycz, M. W.; Hattne, J.; Fulton, T. J.; Stoltz, B. M.; Rodriguez, J. A.; Nelson, H. M.; Gonen, T., The CryoEM Method MicroED as a Powerful Tool for Small Molecule Structure Determination., ACS Cent. Sci., 2018, 4, 1587-1592.
4) C&EN, 2022, OCTOBER, 17th.
5) Shi D., Nannenga B. L., Iadanza M. G., Gonen T., eLife, 2, (2013).
6) Ito, S.; White, F. J., Okunishi, E., Aoyama, Y., Yamano, A., Sato, H., Ferrara, J. D., Jasnowskie, M., Structure determination of small molecule compounds by an electron diffractometer for 3D ED/MicroED., CrystEngComm., 2021, 23, 8622-8630.
7) Aakeröy, C. B.; Fasulo, M. E.; Desper, J., Cocrystal or Salt: Does It Really Matter? Pharmaceutics, 2007, 4, 317-322.
8) Wilson, C. C.; Single crystal neutron diffraction from molecular materials, World Scientific, Singapore, 2000.
9) Rajput, L.; Banik, M.; Yarava, J. R.; Joseph, S.; Pandcy, M. K.; Nishiyama, Y.; Desiraju, G. R., Exploring the salt-cocrystal continuum with solid state NMR using natural-abundance samples: implications for crystal engineering., IUCrJ, 2017, 4, 466-475.
10) Nakai, K.; Miki, K.; Kikuchi, T.; Yamano, M., Detection of Hydrogen Atoms Using Only 3D ED/MicroED and Contribution to Structure Determining Salts or Cocrystals., Growth Des. 2025, 25, 129-135.
11) Unoh, Y.; Uehara, S.; Nakahara, K.; Nobori, H.; Yamatsu, Y.; Yamamoto, S.; Maruyama, Y.; Taoda, Y.; Kasamatsu, K.; Suto, T.; Kouki, K.; Nakahashi, A.; Kawashima, S.; Sanaki, T.; Toba, S.; Uemura, K.; Mizutare, T.; Ando, S.; Sasaki, M.; Orba, Y.; Sawa, F.; Sato, A.; Sato, T.; Kato, T.; Tachibana, Y., Discovery of S-217622, a Noncovalent Oral SARS-CoV-2 3CL Protease Inhibitor Clinical Candidate for Treating COVID-19., Med. Chem. 2022, 65, 9, 6499-6512.
12) Kawajiri, T.; Kijima, A.; Iimuro, A.; Ohashi, E.; Yamakawa, K.; Agura K.; Masuda, K.; Kouki, K.; Kasamatsu, K.; Yanagisawa, S.; Nakashima, S.; Shibahara, S.; Toyota, T.; Higuchi, T.; Suto, T.; Oohara, T.; Maki, T.; Sahara, N.; Fukui, N.; Wakamori, H.; Ikemoto, H.; Murakami, H.; Ando, H.; Hosoya, M.; Sato, M.; Suzuki, Y.; Nakagawa, Y.; Unoh, Y.; Hirano, Y.; Nagasawa, Y.; Goda, S.; Ohara, T.; Tsuritani, T., Development of a Manufacturing Process toward the Convergent Synthesis of the COVID-19 Antiviral Ensitrelvir., ACS Cent. Sci. 2023, 9, 836-843.
13) Cimarosti, Z.; Castagnoli, C.; Rossetti, M.; Scarati, M.; Day, C.; Johnson, B.; Westerduin, P., Development of Drug Substances as Mixture of Polymorphs: Studies to Control Form 3 in Casopitant Mesylate Process. Res. Dev., 2010, 14, 1337-1346.
14) Truong, K.; Ito, S.; Wojciechowski, J. M.; Göb, C. R.; Schürmann, C. J.; Yamano, A.; Campo, M. D.; Okunishi, E.; Aoyama, Y.; Mihira, T.; Hosogi N.; Benet-Buchholz, J.; Escudero-Adán, E. C.; White, F. J.; Ferrara, J. D.; Bücker, R., Making the Most of 3D Electron Diffraction: Best Practices to Handle a New Tool., Symmetry, 2023, 15, 1555.
15) Petricek, L.; Palatinus, J.; Plasil, M.; Dusek, Z., Jana2020 – a new version of the crystallographic computing system Jana., Cryst. Mater., 2023, 238, 271-282.
16) Klar, P. B.; Krysiak, Y.; Xu, H., Steciuk, G.; Cho, J.; Zou, X.; Palatinus, L., Accurate structure models and absolute configuration determination using dynamical effects in continuous-rotation 3D electron diffraction data., Chem., 2023, 15 848-855.
17) Sakai, R.; Higa, T.; Jefford, C. W.; Bernardinelli, G., Manzamine A, a novel antitumor alkaloid from a sponge., Am. Chem. Soc. 1986, 108, 20, 6404-6405.
18) The (+)-manzamine A was gifted by assistant professor Jomori of the University of the Ryukyus as authentic sample.
page top